Researcher Concerns About the Reliability of EU-SILC Income Data in Hungary
[short summary] The EU-SILC study, which monitors the income and social situation of the member states of the European Union, provides data on Hungary through the Hungarian Central Statistical Office (HCSO). Since data collection began in 2005, the proportion of people living in relative income poverty in Hungary decreased in the second half of the 2010s and is still among the lowest in Europe. In this important database, which underpins the calculation of this poverty indicator, the shape of the income distribution in Hungary between 2005 and 2016, closely resembled that of other Central European countries, consistent with the expectations based on similar databases. However, from 2017 onward, the distribution shows several anomalies that cannot be interpreted as reflections of real social processes. We believe these may stem from data cleaning and imputation procedures, resulting in underestimated poverty rates in Hungary in some years. The magnitude of these data problems raises serious concerns about data quality and may undermine the confidence of both domestic and international research communities in this key data source, which is the only basis for studying income inequality and poverty in Hungary.
To support our concerns, we first highlight the importance of the income poverty rate as a key target indicator within the EU, explain how it is calculated, and outline the main stages of the data collection process. We then present interactive graphs showing the income distributions for each year between 2005 and 2023. In our view, the first major data quality issue in the Hungarian data emerged in 2017. From 2018 onwards, we observe variations in the size and shape of income distributions that may point to recurrent methodological errors or potential deliberate interference.
As only the data collection of the Hungarian Central Statistical Office has been available for income poverty analysis in Hungary since 2016, it is feared that the data problems that have been observed every year since 2017 could lead Hungarian poverty research and policy decisions astray. Moreover, the observed anomalies, the news of which has already reached the international user community, could violate the professional principles of statistical data collection and Hungary’s EU commitments, as it is a target indicator for important EU strategies.
Relevance of the relative income poverty rate target indicator
The at-risk-of-poverty rate is not only a crucial indicator for poverty research, but also serves as a basis for EU and national monitoring systems and policies. The European Union has committed to reducing poverty and social exclusion, alongside promoting economic development rooted in innovation and sustainability. These objectives have been translated into EU-level strategies, each supported by target indicators. Previously, the Hungarian target for the Europe 2020 Strategy, adopted in 2010 with targets set for 2020, relied on income poverty indicators. Currently, the Social Scoreboard, linked to the European Pillar of Social Rights, and the draft European Child Guarantee continue to use these indicators and are relevant for Hungary. The poverty indicator also plays a central role in Hungary’s National Strategy for Social Inclusion, which the country has developed under its own responsibility.
The main indicator used by the EU, the rate of people living in poverty or social exclusion, is a composite indicator with three components:
- the at-risk-of-poverty rate (AROP);
- the rate of people living in severe material and social deprivation; and
- the rate of people living in very low work-intensive (quasi-unemployed) households.
The data used to produce these indicators are taken from the EU-SILC survey, which is collected according to the European Statistical System rules in all participating countries and is presented in detail below. In Hungary, income data are collected by the Hungarian Central Statistical Office (Központi Statisztikai Hivatal, hereinafter referred to as HCSO).
Measuring relative income poverty
The common definition of relative income poverty in the European Union is those whose household income per consumption unit is below the poverty threshold. The starting point for the calculations is therefore the total income of each household in a given year. The sources of income data used for the measurement can be (a) administrative databases (e.g. data from tax authorities), (b) surveys, or (c) a combination of the two. In the case of surveys, data are typically collected on a self-report basis, asking separately about the income of individuals and their household members by type (e.g. earned income, social benefits). These are then added together to give the total annual household income.
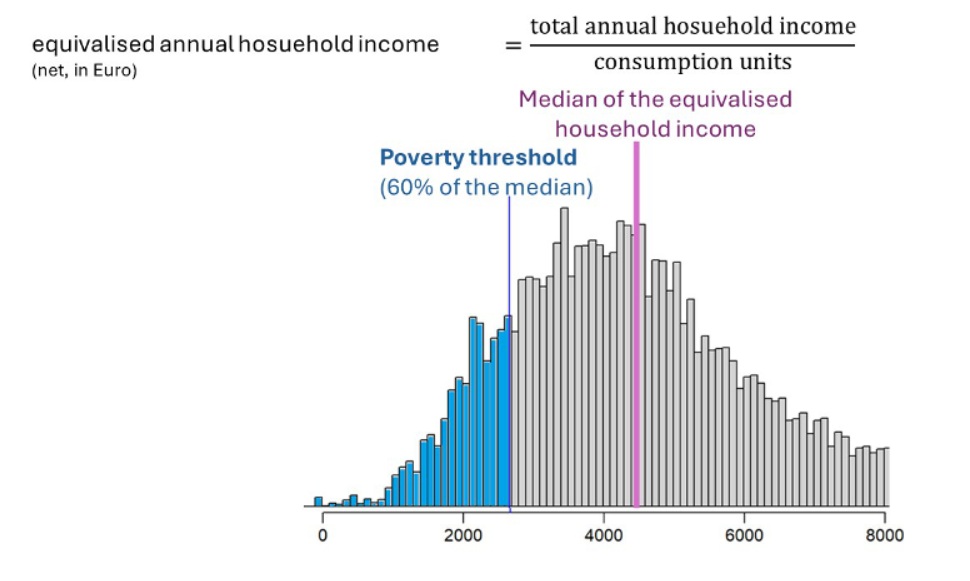
To compare the situation of households of different size and composition, we need to calculate total income per household. However, in calculating the indicator, the total household income is divided by the number of consumption units in the household, rather than by the number of persons living in the household, to allow for economies of scale. For example, a two-person household does not need twice the income to provide the same standard of living for its members as a single-person household. Household members are therefore counted according to their estimated consumption, i.e. weighted: the first adult is given a weight of 1, each additional person over 14 is given a weight of 0.5, and each child under 14 is given a weight of 0.3. For example, in a household with two adults and three children under 14, 1+0.5+0.3+0.3+0.3 = 2.4 consumption units, i.e. 2.4 divided by the total household income.
According to the European professional and political consensus, the poverty threshold is set at 60% of the median of equivalised annual household income in all Member States. In Hungary, for example, the median annual income per consumption unit in 2023 is €7 423 net. This means that in Hungary in 2023, those whose equivalised annual household income was less than 60% of this amount, €4 454 per year (or HUF 1 742 642 per year at 2023 exchange rates, a net monthly income of HUF 145 220), were considered to be living at risk of poverty. The poverty threshold varies from country to country, as income levels and income distribution vary (sometimes considerably). The value of the threshold also varies from year to year.
To summarise: the at-risk-of-poverty rate captures the share of people living below the poverty line, it does not refer to an absolute value (e.g. subsistence level), but it identifies those living in low-income households within a given society as poor.
Calculating the share of people living in relative income poverty using the 2013 income distribution in Hungary as an example
EU-SILC and income data collection practices in Hungary: the role of the HCSO and EUROSTAT
Since 2004, the data needed to produce the target indicators set out in the EU strategies (and many other indicators) have been collected by the Member States, candidate countries and several EU associated countries through their national statistical offices in a harmonised data collection system called European Union Statistics on Income and Living Conditions (EU-SILC), which is harmonised by Eurostat. Hungary has been participating in this program since 2005. The harmonised data collection allows comparisons of income inequality and poverty in Hungary over time and internationally, which is essential for a deeper understanding of social processes. EU-SILC data are collected in Hungary by the HCSO.
In the preparation of EU-SILC, a variable number of households are randomly selected each year (about 6-11 thousand in the period since the start of the EU-SILC in Hungary), but also data on all household members (14-29 thousand persons) are collected each year. Data collection is based on a household questionnaire and on a personal questionnaire for each person aged 16 in the household. In Hungary, the data collection is based on a random sample, personal interviews and, in the case of income questions, on the respondent’s self-report. However, since 2018, according to information from the HCSO staff, administrative data (e.g. income data from the National Tax and Customs Administration and the Hungarian State Treasury) are also used in the data cleaning and imputation phase.
The HCSO has some flexibility in the sampling and the way of data collection (for example wording of the questions asked, etc.), but the structure of the variables to be produced and many details of the methodology are precisely defined by Eurostat. The sampling and data collection, as well as the data cleaning, data checking and imputation (i.e. filling in missing data) phases are therefore the responsibility of the HCSO. The resulting data file is sent to EUROSTAT, where it is first checked, and then the harmonised data set is produced at EUROSTAT headquarters in Luxembourg, where the strategic target indicators are calculated.
The research community is aware of the content of the questionnaires and the harmonised Eurostat dataset is available on request. In addition, the HCSO research room can also be used to analyse the database, which is not included in the harmonised data set and which is supplemented by variables used only in the Hungarian data collection (for example ethnicity). At the same time, researchers have no insight into the technical details of sampling, data cleaning and imputation (how missing data is filled in). Due to the data collection standards set by EUROSTAT, most researchers rely on EU-SILC data, and it is analysed by the research communities in Europe and worldwide.
In Hungary, in addition to the HCSO income surveys, until 2016 there was also the TÁRKI Household Monitor survey aimed at assessing the income situation of Hungarian households, but since then, mainly due to the reduction of research resources, researchers can only rely on the EU-SILC surveys to analyse income and poverty data in Hungary. At the same time, the possibility for data collectors – both the HCSO and TÁRKI – lost the opportunity to use the experience of alternative data collection to validate and verify the results of their own work.
Problems in measuring relative income poverty in Hungary
How the issue emerged?
In recent years, we have used EU-SILC data for Hungary for several projects. We worked on the topic of relative income poverty as part of research project between 2019 and 2023 on explaining poverty trends in Hungary led by András Gábos, and in Annamária Tátrai’s PhD research on small-area poverty estimations. For the analysis, we used a harmonised database containing data from all EU Member States, to which we had access to from EUROSTAT. In addition, in order to examine the specificities of Hungary (e.g. the role of public employment, the situation of the Roma population), we also used the Hungarian database available in the HCSO research room, focusing specifically on country-specific variables.
We already encountered a number of problems in this phase of our research, especially for the period 2017-2020, which we had not encountered in our previous work. The data problems for Hungary were present both in the harmonised database and in the data set available in the the HCSO research room. We have reported problems and asked questions to the relevant department of the HCSO on several occasions. Although we received answers to some methodological details and on one occasion detailed oral information was provided by the staff of the HCSO, we did not receive satisfactory answers to our main concerns even after repeated requests.
In the Social Report 2022, a biennial publication of the TÁRKI Social Research Institute, we pointed out that we have observed previously unique outliers and hard-to-interpret shifts in income data in Hungary. In the same volume, Ákos Huszár drew attention to similar problems. These fluctuations and shifts cannot always be explained by the social processes we observe. We also pointed out that data quality problems may also be behind the poverty gap and the large-scale rearrangements observed in the poverty rates of certain social groups from 2017, and we also referred to other problems we have identified in the data (for example the regional distribution of the sample). We emphasized that more intensive communication between the HCSO and the research community could significantly reduce uncertainties in the interpretation of the data. This would be an essential step toward improving data quality.
Perception of the problem by international actors
The UNICEF report entitled Children and the Cost-of-living Crisis, published in June 2023, examined the impact of the rising cost of living on child poverty in the countries of the European Union, based on EU-SILC data. The authors of the research report contacted TÁRKI researchers (including the authors of this article) in April 2023 because of reliability problems in the data set for Hungary. (What exactly caused the UNICEF researchers’ uncertainty will be discussed later in this article.) Following this request, we embarked on a systematic exercise to examine in detail the variables needed to construct income poverty indicators. In the course of our investigation, we identified a number of problems in addition to those mentioned above, which we forwarded to the HCSO along with UNICEF’s comments, but we did not receive any substantive response to our request. Finally, the UNICEF report published in the summer of 2023 included estimates for all Member States except Hungary. According to footnote 2 of the report, “Estimates include all EU countries except Hungary, for which the analysis is still subject to validation and robustness tests.”
Discourse of the problem
In order to discuss the problem of the Hungarian EU-SILC dataset and in the hope of finding a meaningful solution, we organised a workshop together with the Elek Fényes Social Statistics Association in October 2023, and in November 2024 we presented our results questioning the reliability of the data at the 2024 Annual Meeting of the Hungarian Sociological Association. Recently, several of our research colleagues have raised the following dilemma with regard to EU-SILC data in Hungary: it remains unclear whether the data and the trends they reveal reflect actual social phenomena or whether they (also) point to underlying a data quality issues.
Unfortunately, our efforts to initiate a dialogue with the relevant staff at the HCSO have been unsuccessful. We have not received any meaningful or reassuring responses to our questions. As a result, we feel compelled to step beyond the professional community and share our findings with the public. These findings point to significant data issues which, from 2017 onward, appear to be of such a scale that they could make income surveys in Hungary, and consequently poverty research, impossible.
What do the income distributions reveal?
In the following, we aim to present clearly and in detail the specific data problems we have identified in the EU-SILC income data for Hungary.
Our analysis focuses on the distribution of equivalised household income in Hungary between 2005 and 2023. We present our results visually, using histograms, with income grouped into 100-euro intervals.
– The columns in the histograms represent the number of individuals whose equivalised household income falls within each 100-euro band.
– Each histogram includes a vertical blue line indicating the poverty threshold for the respective year, also referred to as the poverty line.
– Individuals with incomes below the poverty line, those considered to be living in relative income poverty, are highlighted in purple on the graph.
When examining the data as a time series, we find that the income distributions from 2005 to 2016 display no unusual or unexpected patterns; their shapes follow the typical lognormal form characteristic of income distributions. However, from 2017 onward, clear anomalies begin to appear, highlighted in red on the figures. In the interactive visualisation below, you can select a specific year by clicking on the corresponding field. Below each annual graph, we provide a brief description indicating whether an issue is present in the income distribution for that year, and if so, the nature of the problem.
Our main findings based on the graphs for the full sample:
- In 2017, there was a significant increase in the share of individuals with negative income (that is, those who appeared to pay more in taxes than they earned) compared to the previous year. However, this phenomenon does not persist in subsequent years. We are not aware of any social or economic developments, nor any changes in tax collection practices by the tax administration, that would justify 1% of individuals in the dataset reporting negative income in 2017.
- A more persistent and serious problem is the clustering of persons with incomes around the poverty line from 2018 onwards. Between 2018 and 2022, an unusually high number of persons was around the poverty line, typically above it, altering the distribution pattern observed in earlier years This concentration makes the poverty rate highly sensitive to whether these values fall just below or just above the threshold. It also means that a small change in the poverty threshold would result in a more significant increase in the poverty rate. (This is precisely the case in the calculations behind the UNICEF report: to model the impact of inflation in 2022 on child poverty, the UNICEF researchers changed the poverty line from the 2019 survey by inflating it with the 2022 price index and re-entered the resulting value into the income distribution of year 2019. The simulation resulted in such a sharp increase in the poverty rate for Hungary that the researchers questioned the reliability of the data. In the absence of a satisfactory explanation from the data providers Hungary was eventually excluded from the report.)
- In 2023, we observe a considerably higher number of cases at the bottom of the income distribution, between €400 and €1600, than in previous years, and clustering around €7,900. These phenomena are not present in the distributions of previous years.
What could be causing all of this? Which potential causes can we rule out?
Such a high clustering of incomes around the poverty line or at any other point in the distribution in the raw data (i.e. data collected directly through questionnaires) contradicts what we know from the literature or from similar data collected in other countries using comparable methodologies. Indeed, random sampling guarantees the shape of the distribution that we can see in the graphs for the period 2005-2016. Therefore, we must assume that the issue distorting the distribution was introduced during one of the post-collection phases, such as data checking, cleaning, imputation, or weighting. Unfortunately, we cannot determine exactly what happened or at which stage without access to the procedures followed, which are only known to the relevant staff at the HCSO. However, our investigation has uncovered some clues in this regard, particularly through the analysis of income data from single-person households and households with children.
Income distribution of single-person households
The interactive graph below shows the income distribution of single-person households, together with the minimum wage in each year shown by a vertical green dashed line from 2009 onwards. This allows us to check whether the clustering points align with the minimum wage.
The income distribution of single-person households reveals several problems.
- In 2017, the number of households with negative incomes is exceptionally high.
- In 2020, there is a clustering of single-person households just above the poverty line at a scale that is difficult to explain. In total, there are 379 single-person households with an annual income between €3,900 and €4,000 in 2020, which is four times the number of cases in the next most frequent income range. In principle, it is conceivable that a significant proportion of single-person households were found to have missing income during the data validation phase, and the algorithm then imputed similar or identical income values for these households based on other characteristics. If the amount is administratively determined, such as a minimum wage, it might explain some of the income variation. In contrast, however, we found that 322 single-person households in this income band had exactly the same income (€3,996.31109174 to be precise), which is almost impossible without a direct correction or imputation of the final household income variable during the data correction phase. Even if we assume the highly unlikely scenario that 322 of the single-person household members (14% of single-person households) in a given year would have received the same wage (e.g. minimum wage), the total household income includes other income components (e.g. social or inter-household transfers), and thus we would expect some variation in the total income. In addition, when examining the distribution of individual earnings alone, we did not observe the same clustering, so this explanation can be ruled out for several reasons.
- In 2021, the €3,300-3,500 income band is ‘empty’, and in 2022 the €3,300-3,700 band is ‘empty’, meaning that they contain far fewer observations than expected. In previous years, such a change in the shape of the distribution around the poverty line has never been observed.
- In 2023, the income bands below €2,000 for single-person households are completely empty, which could not be observed in previous years. In previous years, 4-8% of single-person households belonged to this income bracket, but by 2023 this income bracket has virtually disappeared from the single-person household population, with a share of only 1 thousandth.
Income distribution of persons in households with children
Similar anomalies were found in the equivalised household income distribution for persons in households with children.
- In 2017, there is a striking decline in the number of observations below the poverty line, with the distribution no longer following the classic pattern seen in previous years.
- In 2018, 2019 and 2021, the proportion of households with children with income just above the poverty line is very high, clustered in a narrow band of €100-200.
- In 2020, the number of observations below the poverty line increased dramatically, particularly in the band just below it, which distorts the overall distribution.
- In 2023, the proportion of people in the lowest income band, below €2 000, appears unusually high. This is particularly striking when compared to the near disappearance of the same income band for single-person households.
Households with children have an even more complex income structure than single-person households. As a result, the probability of households with children clustering within a very narrow band based on their equivalised income per consumption unit is almost negligible. Therefore, it can be assumed that in the years after 2017, data correction and imputation (also) occurred at the level of equivalised income, which contradicts the established data cleaning procedures. Indeed, correction or filling in of missing data should be done at the level of income components. If this procedure had been followed by the relevant the HCSO staff, there would have been less chance of anomalies in the distribution. Although we consider it unlikely, it cannot be ruled out that a fully professional imputation at the level of equivalised household income has been made, but we do not have information on this.
In conclusion, looking at the income distributions of both single-person households and persons in households with children, the results suggest that the imputation during the database refinement process occurred not at the level of income components, but likely at the equivalised household income level. This approach deviates from both international and national best practices and could be considered as a professional error. It also raises concerns about the possibility of data manipulation.
Conclusions
Monitoring and understanding social processes requires high-quality, reliable and accessible data for both researchers and policymakers. This is especially critical when it comes to income measurement, which presents numerous challenges for data collectors using surveys, These challenges are particularly pronounced in a rapidly changing environment, marked by declining response rates and the increasing integration of administrative data over the past decades.
In this paper, we have aimed to provide a detailed description of the various data problems that have emerged in the income data provided by the Hungarian Central Statistical Office (HCSO) to EUROSTAT since 2017. Most of the anomalies identified point towards a reduction in the poverty rate.
According to EUROSTAT data, provided by the HCSO for Hungary, the relative income poverty rate ranged between 14.5% and 15% from 2013 to 2016. However, during the period when data problems related to the poverty line emerged, from 2018 to 2023, the poverty rate ranged between 12.1% and 13.1% each year, reflecting a notable decrease compared to the previous period.
Such large deviations from the expected distribution could raise concerns and potentially undermine confidence in the reliability of the data. This may cause uncertainty for both domestic and international data users and researchers about the data’s ability to accurately describe and explain real social processes. It could also leave policymakers unsure whether their decisions are based on reliable or biased data. Moreover, the imputation process described in this article, as we have assumed, violate Regulation (EC) No 223/2009 of the European Parliament and of the Council, Regulation (EU) No 1700/2019 of the European Parliament and of the Council, as well as the European Statistics Code of Practice.
The purpose of this paper is to highlight and present this important issue to the public, in the absence of cooperation from the HCSO. Collecting, compiling, and providing reliable, high-quality statistical data is a challenging yet essential task for all of us. It would be valuable to foster an open and trust-based cooperation between the HCSO, the research community, and now the public, to address these challenges. Such collaboration could help identify the causes of data inconsistencies and develop both retrospective and future solutions to improve the reliability of the data.
The code used for the interactive figures is available at: https://github.com/AnnamariaTatrai/EUSILC_HU_reliability
The authors of the article would like to thank Dóra Cseri, Zsófia Tomka, Tamás Ziegler Dezső, János Simon, Péter Szivós and Lili Vargha.


